| << Home | Next Exercise >> |
|---|
Getting to know Steeltoe
Goal
Understand how Steeltoe is distributed (NuGet) and how one adds components into an existing application.
Expected Results
Begin building an API that will be enhanced with more components in the next exercise(s).
Get Started
Let's start by creating a brand new ASP.NET Core Web API project.
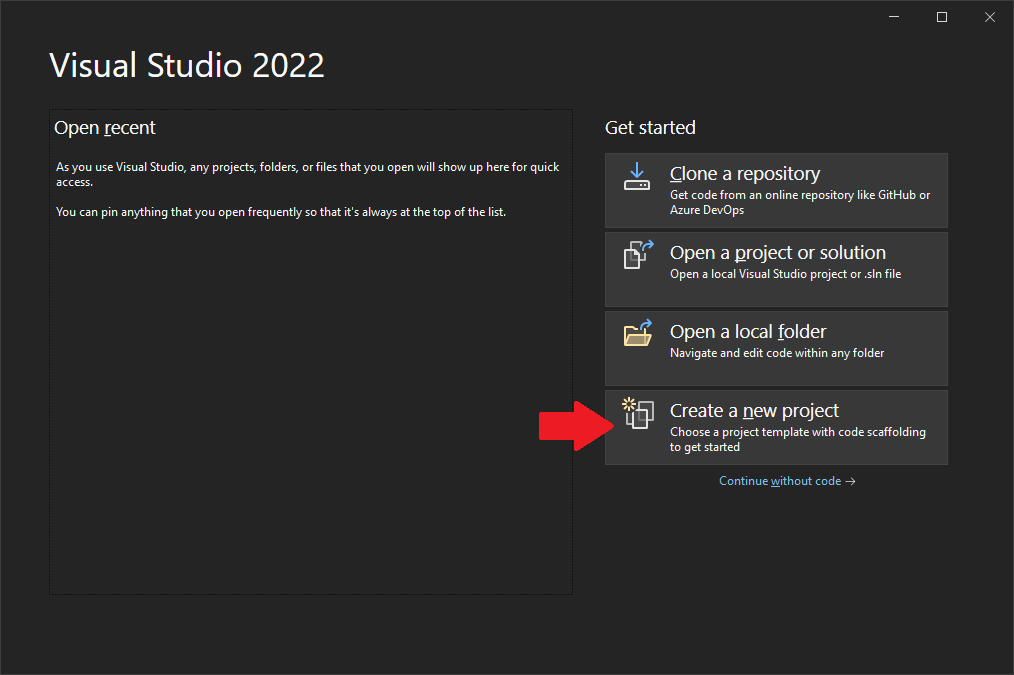
Select "Create a new project". (If Visual Studio is already open, choose File > New > Project.)
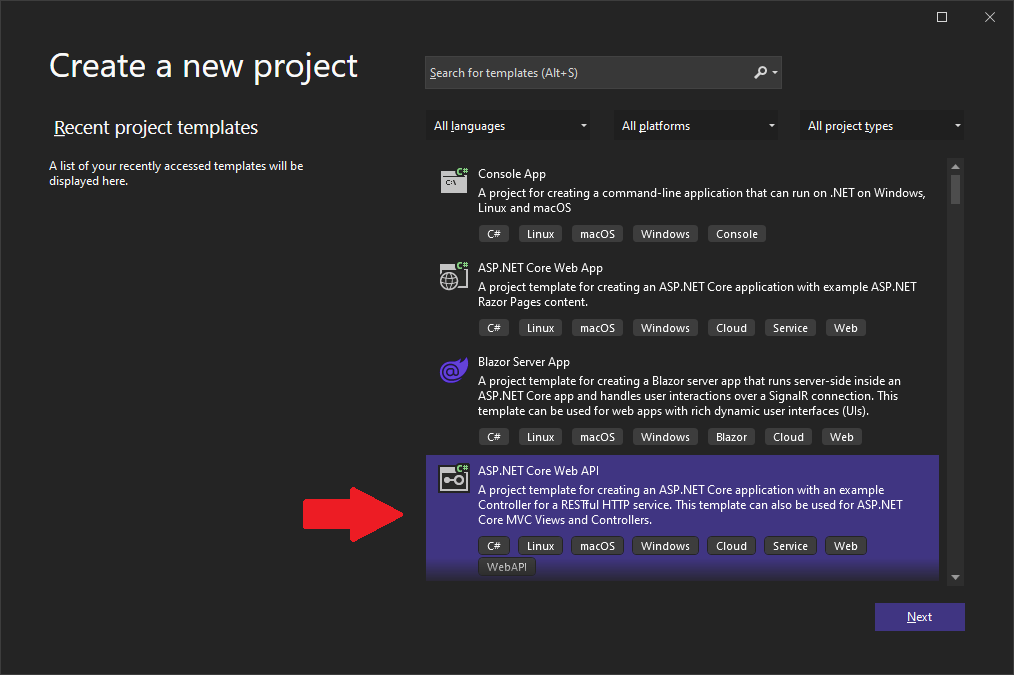
Choose "ASP.NET Core Web API" from the default templates.
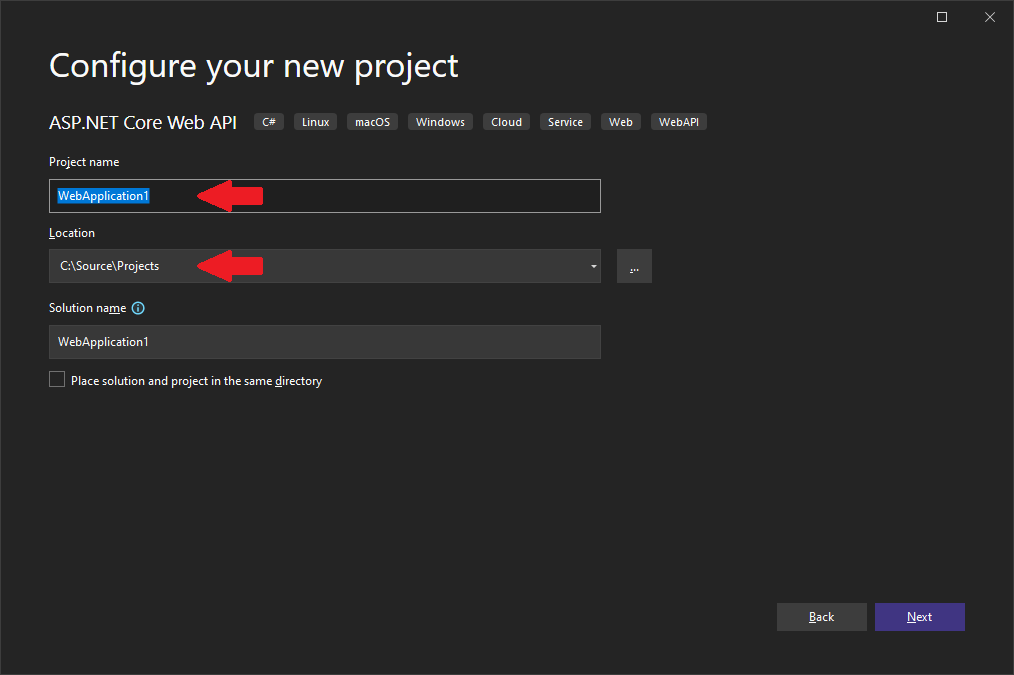
The default project name WebApplication1 will be used throughout, but you can rename it.
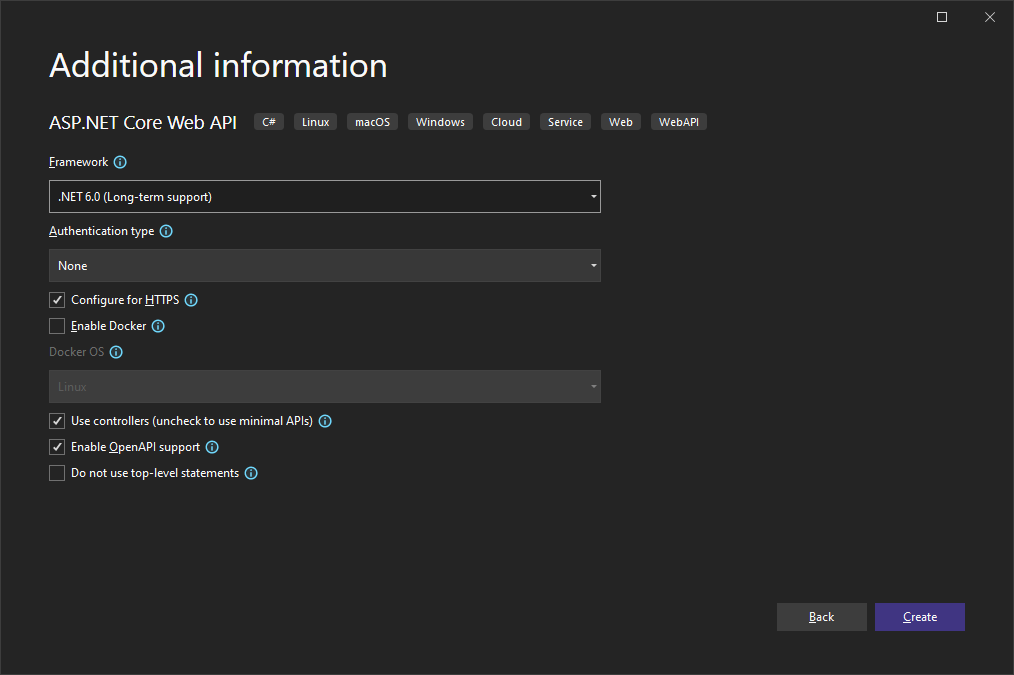
At "Additional information", you can keep the default values.
Add Project Dependencies
Once the project is created and opened in your IDE, the first action is to bring in the Steeltoe packages to the app.
Right-click on the project name in the solution explorer and choose "Manage NuGet packages...." In the package manager window, choose "Browse", then search for Steeltoe.Management.EndpointCore, and install.

Finally the Steeltoe.Management.TracingCore package and install.

Use Steeltoe packages
Steeltoe features are broken up into packages, giving you the option to be selective about which components are included. As we use each of these packages within the application, we'll discuss why they were chosen.
Open "Program.cs" in the IDE and add the next using statement:
using Steeltoe.Management.Endpoint;
Then append the 'adding' statements to the application builder and save the changes
// Add services to the container.

// Steeltoe actuators
builder.AddHealthActuator();
builder.AddInfoActuator();
builder.AddLoggersActuator();
We've just included three features within the application by adding these actuators.
- The health actuator adds a new endpoint at
/actuator/health. This endpoint retrieves health contributors that have been registered in the application's service container with either Steeltoe'sIHealthContributoror Microsoft'sIHealthRegistrationto aggregate the health checks of all the application's dependencies. This endpoint use the HTTP status code of 200 when everything is OK and 503 when it isn't. Details of the health checks can be included in JSON-formatted responses, too. - The info actuator adds a new endpoint at
/actuator/info. This function gathers all kinds of information like versioning information, select package information, and anything you'd like to include with your own customIInfoContributor. Everything is formatted as JSON and included in the response. - The logger actuator enables dynamic log level management at runtime and enhanced log message details via
ILogger.
Enable distributed tracing
In "Program.cs", add the next using statement
using Steeltoe.Management.Tracing;
Add the distributed tracing feature to the service container:
// Add services to the container.

// Steeltoe distributed tracing
builder.Services.AddDistributedTracingAspNetCore();
With the addition of the distributed tracing option, under the covers, Steeltoe uses the OpenTelemetry specification to generate and propagate spans and traces throughout the application, as requests are received. No additional configuration is needed, but if you wanted to manipulate how traces and spans are created you could provide settings in "appsettings.json", read the docs for more information.
Tip
Having the combination of the logging actuator and distributed tracing enabled, Steeltoe will automatically append the application name, span Id, and trace Id on log messages when possible. This can be very handy when debugging a specific happening or error in production.
Add a sample logging message
To see the trace logging in action, let's add a log message in the "Controllers\WeatherForecastController.cs" controller class. Append the below message as the first line in the Get method.
[HttpGet]
public IEnumerable<WeatherForecast> Get()
{
    // Testing Steeltoe logging with distributed tracing
    _logger.LogInformation("Hi there");

    // ...
}
Run the application
With the packages registered in the application builder, distributed tracing activated, and a sample log message being written to the console, we are ready to see everything in action. Run the application.
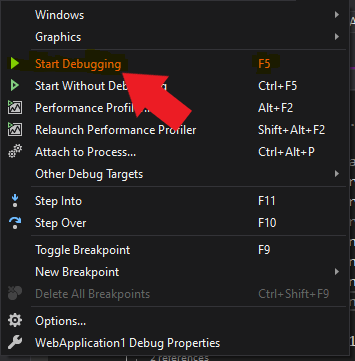
Click the Debug > Start Debugging top menu item. You may be prompted to "trust the IIS Express SSL certificate" and install the certificate. Once started, your default browser should open and automatically load the weather forecast endpoint.
With the application running and the weather forecast endpoint loaded, your browser should show the following

Note
If "Enable OpenAPI support" was checked at project creation, the Swagger endpoint is used as the startup page. Replace "swagger/index.html" with "WeatherForecast" to get the response above.
Discover the health endpoint
Let's look at the health endpoint. Replace WeatherForecast with actuator/health in the browser address bar. The health page will load with JSON formatted info.

As we discussed above, the fact that the page loaded (status of 200) is the first communication to the application's platform that it is healthy. Secondarily, the application has output information to help certain platforms gain a deeper knowledge of app health. Learn more about the health endpoint here.
Discover the info endpoint
Now navigate to the info endpoint by replacing health with info in the address bar.

We have loaded the bare minimum application info for this example. You could build your own IInfoContributor and add all kinds of metadata and connection information. Learn more here.
Observe trace and spans appended to logs
Finally, let's look at the log message that was written.
Go back to the terminal window where the application was started. The logs should be streaming. Locate the following line:
[WebApplication1, 917e146c942117d2, 917e146c942117d2, true] Hi there
Notice the additional information prepended to the message. This will be automatically written to logs, so whatever platform or cloud you might be using, the message will give you quite a bit of context.
- The first item is the application's name
- Second is the OpenTelemetry generated span id
- Third is the OpenTelemetry generated trace id
Stop the application
Either close the browser window or click the red stop button in the top menu.
Summary
These are the basics of any cloud ready microservice. Logging and debugging are significantly different than a traditional IIS environment. But! A developer shouldn't be spending tons of time coding these boilerplate-type things. Heeelllo Steeltoe!
| Next Exercise >> |
|---|